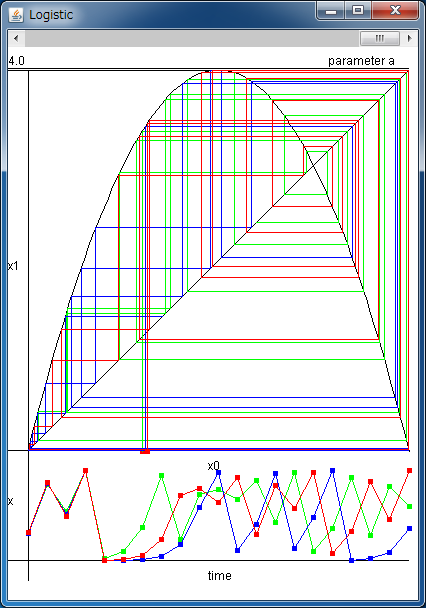
Time Series of Logistic Map


After downloading logistic.jar, please execute it by double-clicking, or typing "java -jar logistic.jar".

You can set three initial points by clicking the upper field.

If the above application does not start, please install OpenJDK from adoptium.net.


We treat the logistic map here. It's known as a simple model which yields chaos, written as

xn+1=axn(1-xn) (n=0,1,2...),

where 0<=a<=4. This is a discrete-time map which receives a real number between 0 and 1, and returns a real number in [0,1] again.

n denotes a discrete time step and xn denotes a data at n.
For example, xn can be regarded as an annual change of the number of an animal, a change of the price of a stock of every month, and so on.
Such an equation which governs the changes of data for discrete time steps is called the difference equation.

Although the logistic map had been known since early times, Dr. Robert May first found that this map shows very complicated behaviors in the paper entitled as "Simple mathematical models with very complicated dynamics" published in Nature in 1976.

First we take x0 as the initial value. Using the above equation, we can calculate x1, x2, x3. In these procedures, we have no statistical features. So time series xn (n=0,1,2...) is called deterministic.
Using the above simulator, we can get these sequences x0, x1, x2, x3... diagrammatically.

Two graphs are drawn in the upper field.

y=4x(1-x)
and
y=x.

Please click your mouse on the upper side of the simulator, then its x-coordinate is set as the initial value x0 and a red point is plotted. This simulator draws a vertical line from the red point to the parabola. The y-coordinate of the intersecting point is x1. This value is returned to x-axis using the line y=x. And we can get x2, x3... with the same procedure. This simulator calculates up to x20. You can choose three initial conditions, that is, x0, x'0, x''0. These series are drawn in different colors.

In the lower field of the simulator, the derived time series xn (n=1..20) is plotted in a line. Even if you choose nearby initial points, these sequences will be separated as time passes. From this result, we can see that chaos is sensitive to the initial condition. It's also called butterfly effect.

With the scrollbar, you can change the parameter a from 0 to 4. In some parameter value, there is no chaos and only periodic orbits appear.

The logistic map cannot predict the number of animals nor the price of stocks because the logistic map is not a quantitative model, but a qualitative one.
However, the logistic map is thought to be important in the research of chaos because it is simple and has universal properties.

The parabola of the logistic map shows the stretching and folding processes of chaos. Such structure of chaos is also observed in many nonlinear models, such as Lorenz attractor which is derived from a model of the atmospheric convection, and the synchronous behaviors in a neuronal network.
Such similarities are observed in many models because the logistic map is universal.

Reference

Bifurcation Diagram of Logistic Map >>

Introduction to Chaos and Nonlinear Dynamics