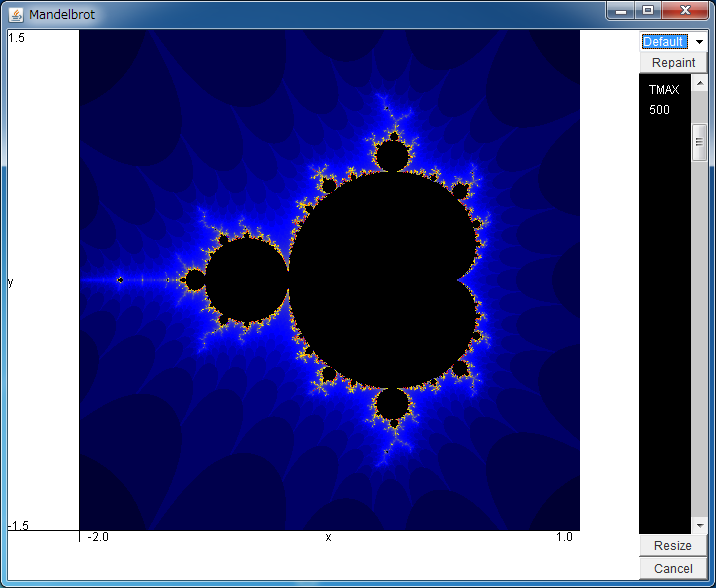
Mandelbrot Set


You can expand the area by dragging the field with your mouse.

If you download the ZIP file, you can change the size and colors of this simulator by editing the html file.

You can also try Android phone version of this application.
If the above application does not start, please install Java from here. >>

Let us consider a map in the complex plane written as
z n+1 = zn2 + c.

Depending on the value of complex parameter c, the trajectory zn from the initial condition z0=0 converges to fixed points, periodic orbits, or chaotic orbits, but with some values of parameter c, zn diverges to the infinity.

The set of parameter c for which the trajectory does not diverge is called as Mandelbrot set.
This simulator shows the Mandelbrot set in the complex plane.
The set is colored with black, and the points which do not belong to it are colored depending on the time to diverge.

When the simulator is expanded with your mouse, Mandelbrot set shows infinitely fine structures.
Dr. Mandelbrot named such a structure with self-similarity as fractal.

In the later researches, Dr. M. Shishikura mathematically proved that the dimension of the boundary of the Mandelbrot set is 2, and it is connective.
In many cases, the fractal figures have non-integer dimensions, thus the above proof means that the Mandelbrot set is not an typical example of fractal.
However, the impact which Mandelbrot set gives to the researches on fractal and chaos is large,
thus it is often introduced as a monumental diagram even now.

By the way, with the right bar, this simulator can control the time (TMAX) to judge whether the trajectory diverges or not.
To obtain the boundary of the Mandelbrot set precisely, TMAX must be large.
Note that the larger TMAX is, the longer the time for calculations becomes.

<< Various Pendulums / Julia Set >>

Introduction to Chaos and Nonlinear Dynamics