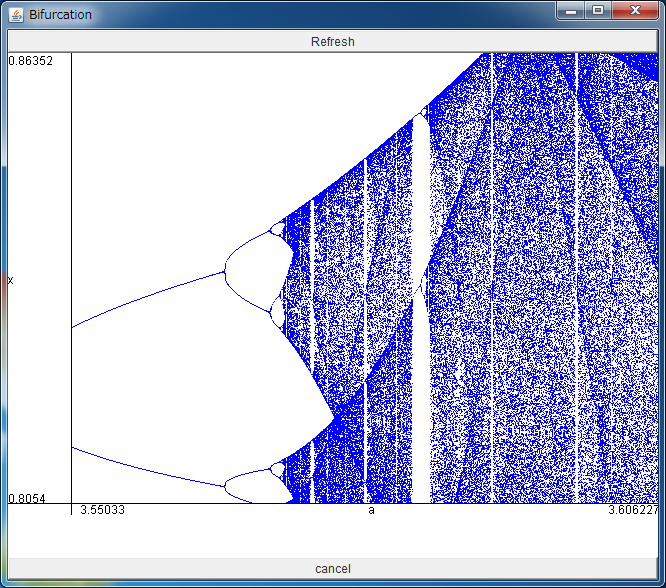
Bifurcation Diagram of Logistic Map


After downloading bifurcation.jar, please execute it by double-clicking, or typing "java -jar bifurcation.jar".

You can expand the area by dragging the field with your mouse.

If the above application does not start, please install OpenJDK from adoptium.net.


Here we treat the logistic map which yields chaotic orbit, written as

xn+1=axn(1-xn),

where 2 <= a <= 4. This map receives a real number between 0 and 1, then returns a real number in [0,1] again. The various sequences are generated depending on the parameter a and the initial value x0.

The simplest example is the case where the sequence xn converges to a fixed point xe independent on the initial value x0. Such situations are realized when the parameter a is in the range [2, 3]. You can confirm this fact in "Time series of logistic map" simulator. The destination set where some initial values converge to, is called an attractor. In the above case, the fixed point is the attractor.

When the parameter a exceeds 3, what happens to the sequence xn ?
As you can see with the help of "Time series of logistic map" simulator again, the sequence converges to a periodic orbit with period 2. In other words, the periodic orbit with period 2 becomes an attractor.

If you increase the value of the parameter a, the period of the periodic orbit will be doubled, that is, 4, 8, 16....
Such the change of the orbit structure with the change of parameter is called bifurcation.

The above simulator visualizes this cascade of bifurcation from a fixed point to chaos. The horizontal axis denotes the parameter a, and the vertical one denotes the variable x. At the point where a line bifurcates to two lines, the fixed point becomes unstable, and a periodic orbit with period 2 appears, and similar periodic orbits with period 4, 8, ... would appear by increasing a. This is called period-doubling bifurcation, and beyond this cascade, the stable periodic orbit disappears and chaos appears at a=3.5699456.... Such the period-doubling route to chaos is often observed universally in many dissipative systems where the energy of system is not preserved.

When you drag the area of the above simulator with your mouse, the region would be expanded. You can observe that the bifurcation diagrams similar to the original one are embedded in the details of this bifurcation diagram. Such self-similarity is called fractal.

When a is in the range about [3.831874055, 3.857082826], the window of period 3 is observed, which is related to Li and York's famous paper "Period 3 implies chaos" (1975).

Reference

<< Time Series of Logistic Map / Attractor of Hénon Map >>

Introduction to Chaos and Nonlinear Dynamics